
We are excited to release Cutter v2.0 — the first release of Cutter that is using Rizin as its core backend. Since forking radare2 and creating Rizin, we invested countless hours in improving the projects feature, overall stability, and the way we work. Releasing Cutter 2.0 is a significant milestone for us, as we believe that the recent improvements we made to our core — Rizin, and to Cutter itself, are the starting point of creating a better reverse engineering software.
Many of you waited for our first release with Rizin, and now the time has finally arrived. In this post, we note down some of the recent changes we have made to Cutter and what you should expect to see in this new release. To view the detailed changelog or download Cutter 2.0, check out the release on GitHub!
Highlights
Saving and loading your work with Projects
During reverse-engineering sessions, it is crucial to be able to keep track of the gained knowledge through annotations such as comments, function and variable names. As such, the tool one is working with also needs to provide a reliable and future-proof way to save and restore this information. This functionality was deeply important to us and to our users and was requested by the community often.
Up to this release, Cutter had only a basic and unreliable support for saving the user’s work in projects, a functionality provided by radare2. When Rizin was forked from radare2, the team decided to create a reliable mechanism of saving and loading projects from scratch. The technical details of this newly created projects feature are described in a dedicated post published in rizin’s blog.
Cutter 2.0 introduces full support for Projects, and you can now save and load you work seamlessly. The feature is in beta support that will last until the first major release of Rizin (v1.0).
By the way, because Cutter directly uses Rizin’s project format, projects created in command-line Rizin can be directly loaded in Cutter and vice-versa, giving you the possibility to change between both tools whenever you want.
Saving a project
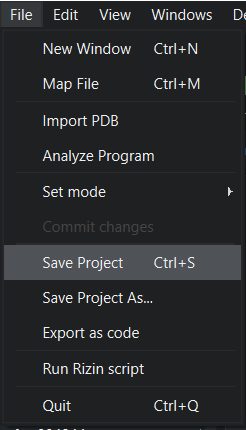
Saving your work in a project is simple and intuitive. Click on the “File” menu and choose “Save Project” or “Save Project As”. This will open a dialog that will ask you where do you want to save the new project. The extension for Rizin and Cutter projects is .rzdb.
Those of you who wish to use keyboard shortcuts can use Ctrl + S to save the project. You can use these shortcuts many times during your work to save the changes to the project file.
Loading projects
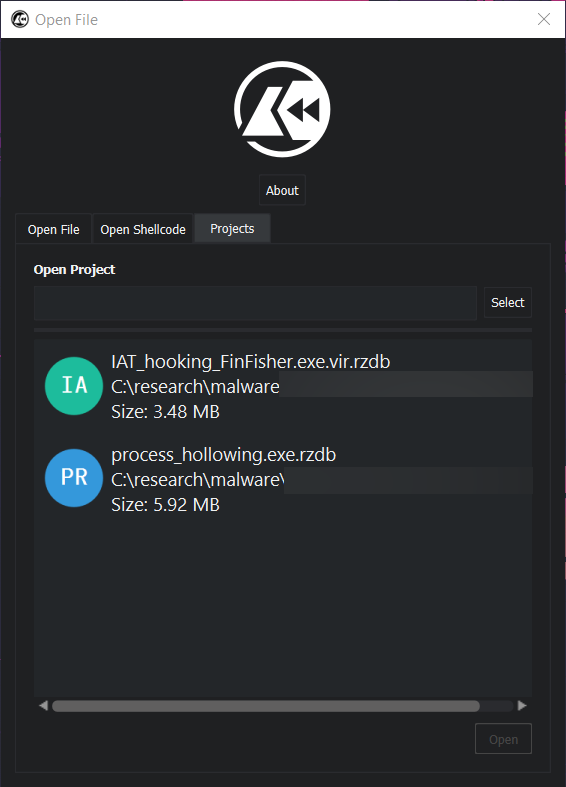
Opening projects in Cutter can be done in two ways. The first one, is from the Projects tab in Cutter’s opening dialog. To do this, open Cutter and click on the Projects tab. In there, you will see the recent projects you created or loaded. Double-click on a project, or click “select” and choose another project file from the dialog.
The second option to open a project in Cutter is via the command line. To do this, run Cutter with the -p or --project flag:
cutter -p demo.rzdb
Cutter now supports Reverse Debugging
Another feature that we’re very excited about in this release is the addition of reverse debugging to all debug backends, including remote and ESIL. Reverse debug allows you to move the program counter backwards and revert the program state to the saved state at that point.
The debug toolbar now includes the option to start a ‘trace session’ that enables reverse debug:
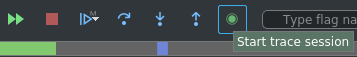
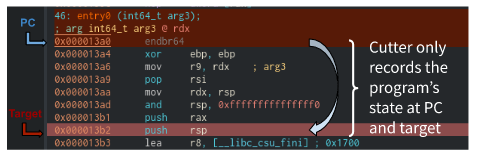
Once you start a trace session, Cutter begins recording the program’s memory and register changes from the current program counter. This allows you to step backwards and continue backwards to restore the program’s state up to the trace session’s first recorded instruction:

When stepping or continuing back, we locate the target instruction in the recorded session and revert the state of the registers and memory up to that point. It’s important to note that Cutter doesn’t handle non-deterministic events like signals or syscalls.
Continuing back to the future
Similarly to regular continue, backwards continue currently only stops due to an interrupt (by clicking on the “suspend process” button) or a breakpoint. Otherwise, it will continue all the way back to the session’s first instruction.
Since Cutter stops at every instruction to record memory and register changes while continuing, this may significantly slow down the traversal between two points. To solve this issue, we have also added the dbg.trace_continue(default=true) flag to the debug settings. This flag allows the user to save the program’s state only between two states: the first state is the original program counter position before continue, and the second is the destination of the run. This means that stepping backwards will also return to the last recorded point before continue as illustrated:
dbg.trace_continue=false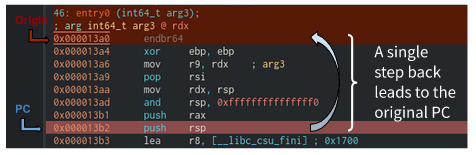
dbg.trace_continue=falseCompared to being able to step back to any point after continue with dbg.trace_continue=true:
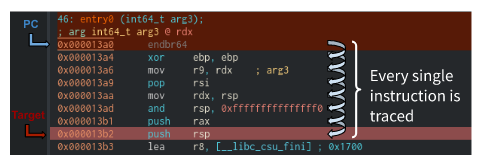
dbg.trace_continue=true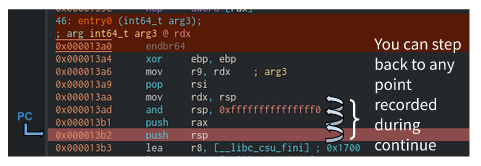
dbg.trace_continue=trueImproving the renaming workflow
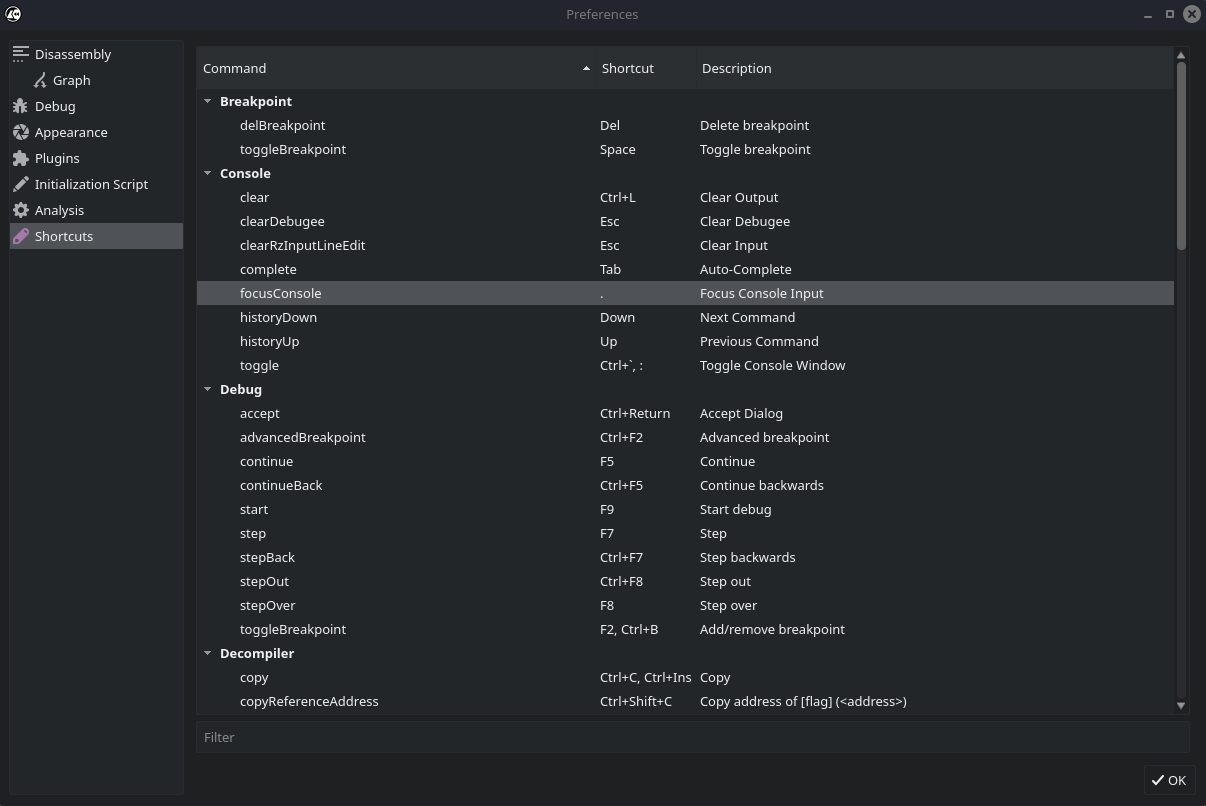
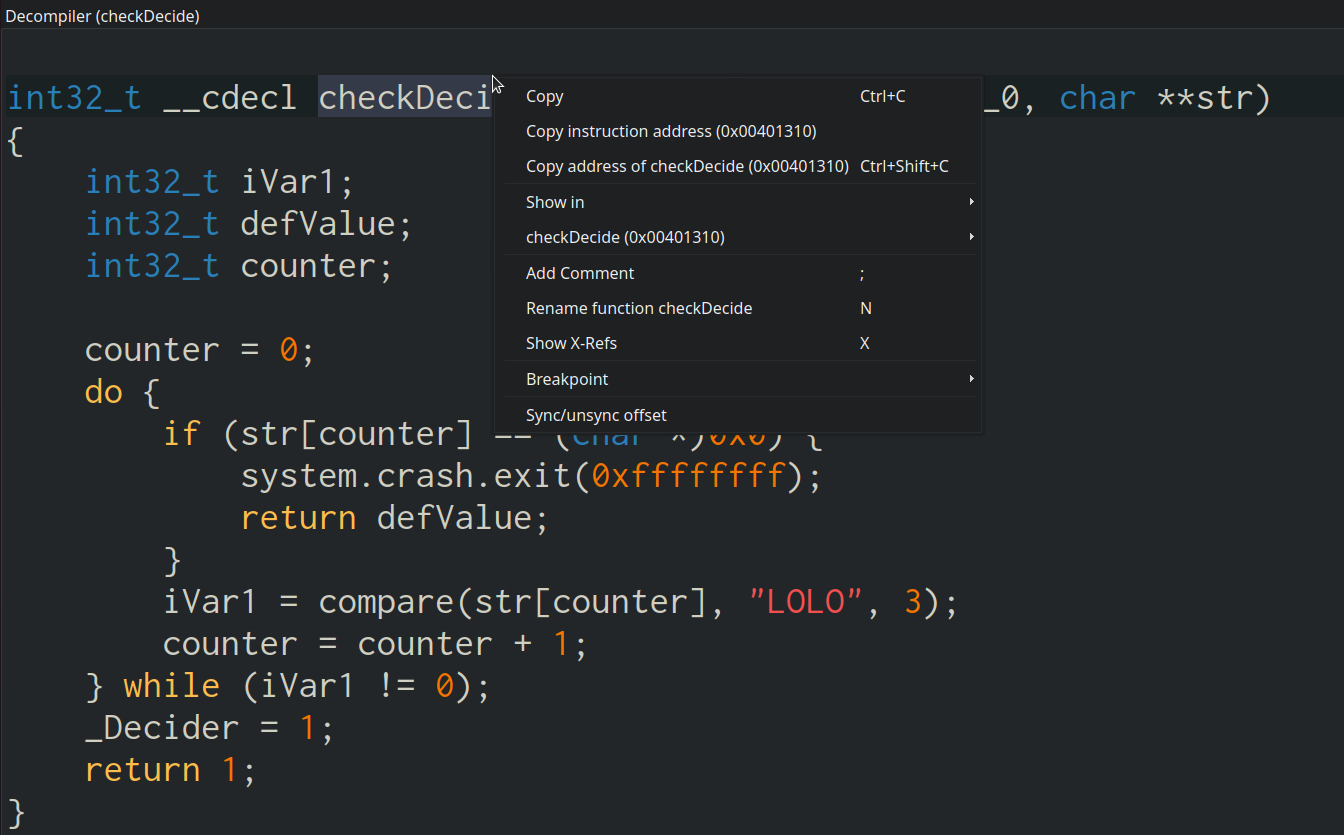
Last year, we asked you what are the things you want to see improved in Cutter. Many of you mentioned that the basic workflow of renaming isn’t user-friendly and can be improved. And indeed, during the recent months we worked on improving it and created an easier renaming workflow in which you can press N in many places in the disassembly to rename functions, flags, and more. You can also use N to add new flags in certain addresses.
There are more improvement to do when it comes to renaming in Cutter, such as having better support for renaming symbols and renaming information in the decompiler. We plan to improve these areas in future releases.
Basic block headers in Graph view
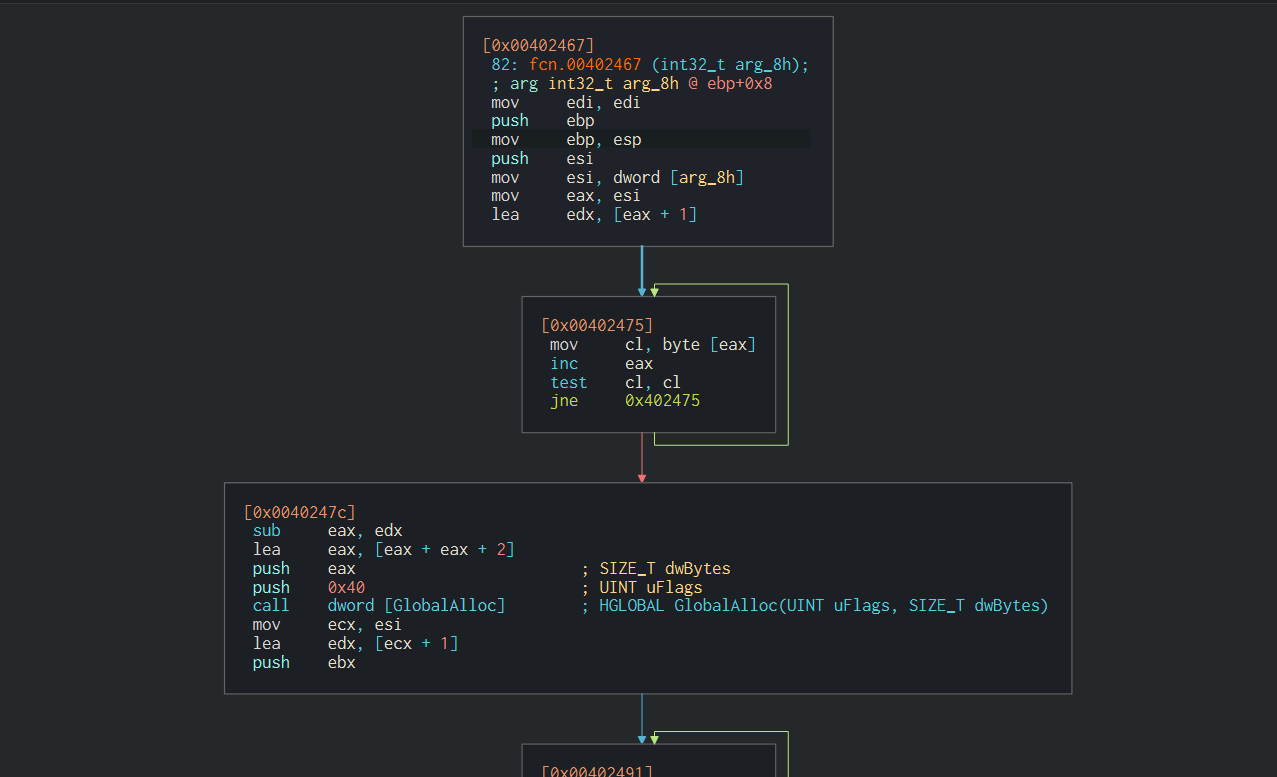
A new feature that was added in Cutter v2.0 is the option to display the basic blocks offsets in the Graph view. When enabled, each basic block will have its start-address displayed at the top. This feature can be enabled or disabled from the preferences view: Edit → Preferences → Disassembly → Graph → Show offset of the first instruction in each graph block.
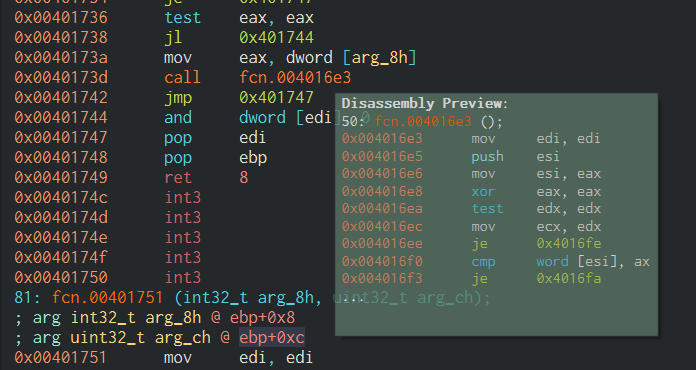
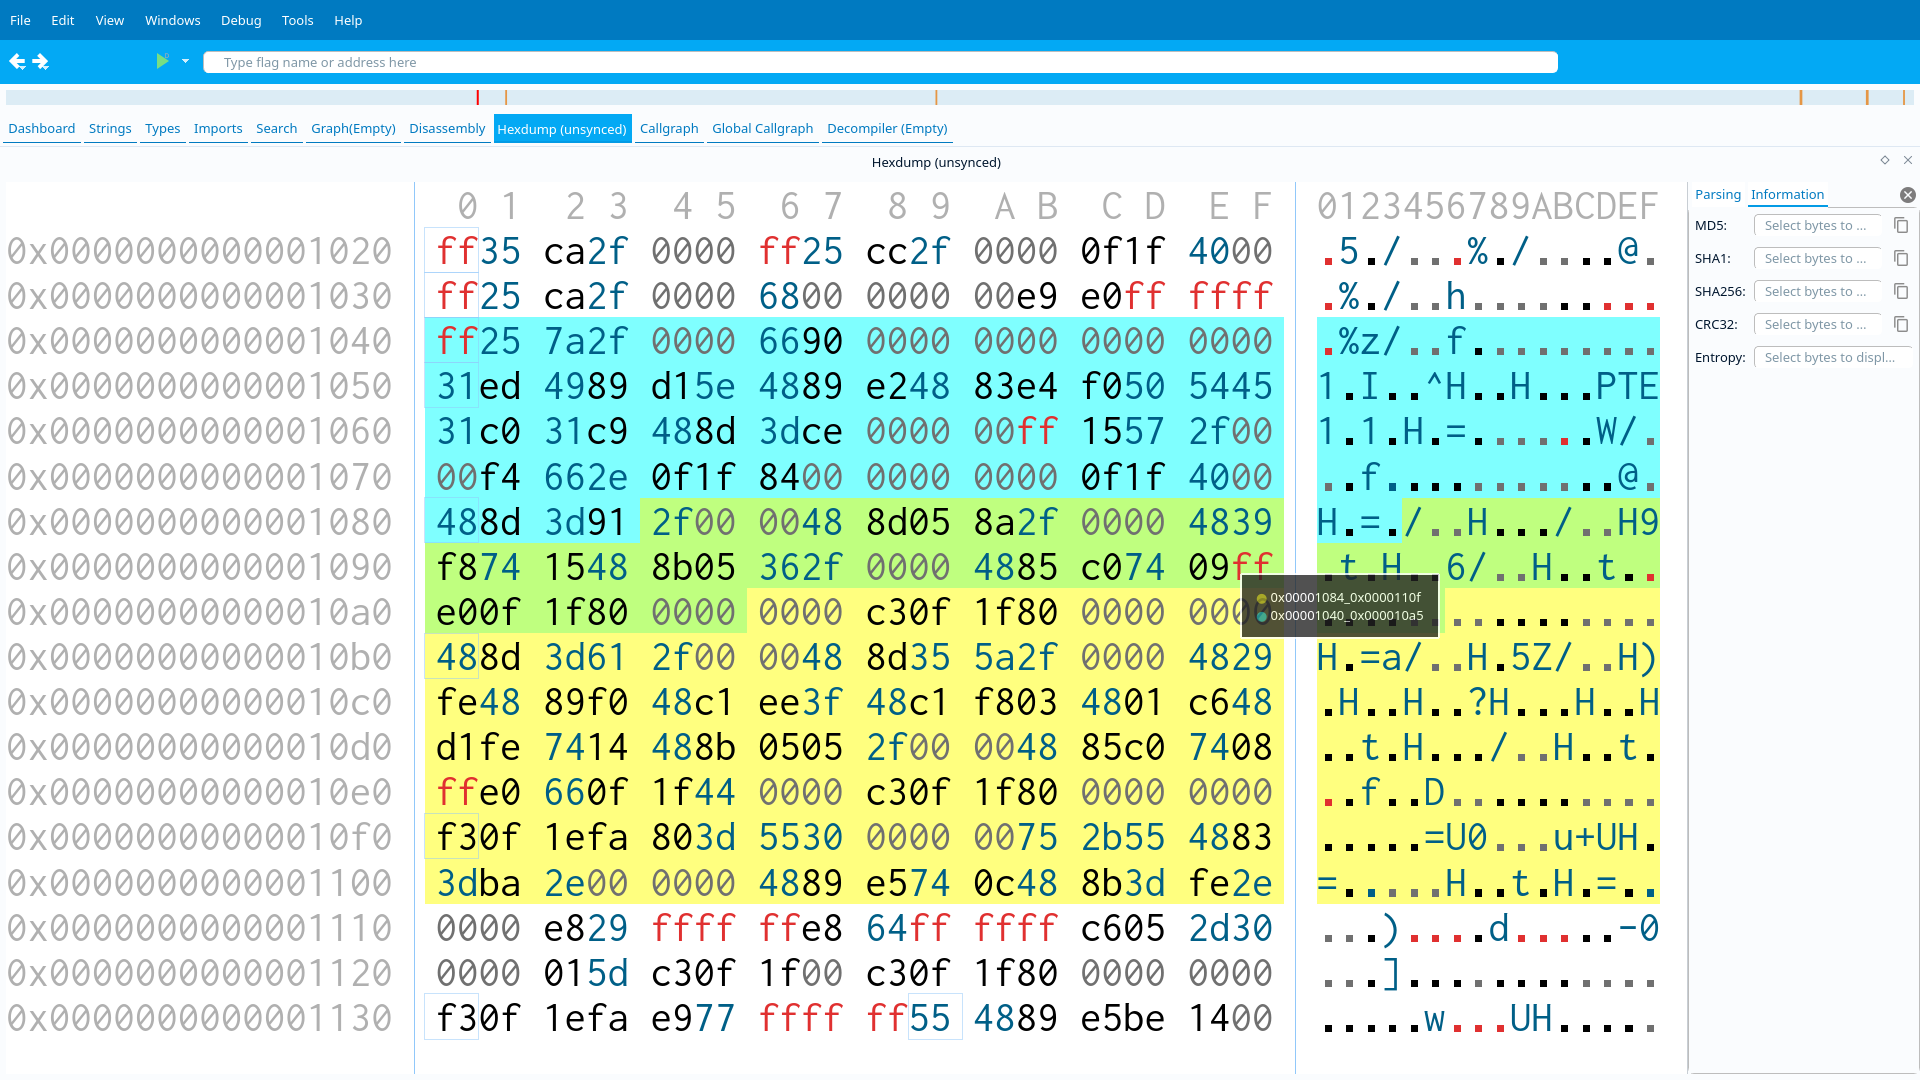
Hover on address to view its content
The functions widget of Cutter had a functionality that allowed the user to preview the contents of a function by hovering with their mouse on a function name from the list. Now, in our new release, we expanded this feature and added support for previewing the contents of a function, flag or address, by hovering on them in the disassembly view. This will allow you to quickly view data and code in target address, without navigating to this address.
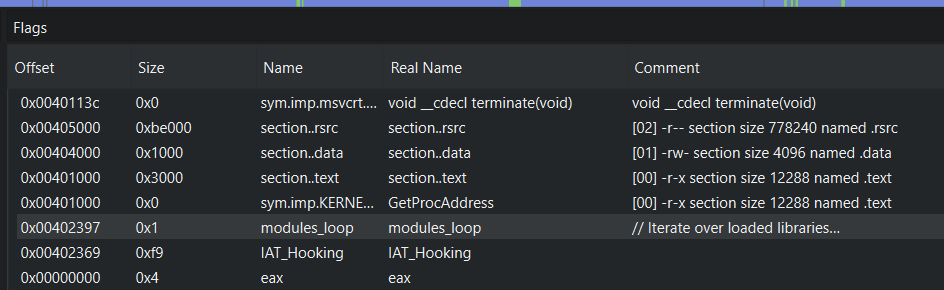
New Comment Column in multiple Table Views
We improved multiple table view widgets to now display comments that are being added in these addresses. For example, if the user added a comment to an offset of a string, or of a flag, the comments will be displayed in the list.

